Interpretation of Topography
Corneal Topography is the process of mapping the curvature of the corneal surface, much like a geographical topographer would map the height and gradient of a hill for an ordnance survey map, albeit using completely different methods. The modern corneal topographer is a sophisticated computerised camera which discovers the curvature of the cornea using reference data to judge the differences on a point by point basis. Different machines do this in slightly different ways, the current "Gold Standard" is the Oculus Pentacam machine which uses a slit beam of light to produce several cross sectional views of the cornea and calculates the data from these images. The images produced below are taken from the Medmont E300 topographer, this system projects an image of concentric circles onto the cornea and then captures the reflection of these rings. It judges the corneal shape by measuring the slight differences between the rings of the projection compared to the reflection images.
The following images are colour coded maps and are used to easily assess the data. Again there are different ways of presenting the data, here I have chosen to use an "axial curvature" map. There is no need to go into detail about this other than to say that there are numerous interpretations of the same data which can make the overall picture appear different. I have chosen these maps for their visual clarity in order to explain the different types of conditions that can be assessed. To explain the colour coding, the flatter areas of curvature are represented by the colder colours (ie greens & blues) whereas the steeper areas are represented by the hotter colours (ie reds & oranges).
The following images are colour coded maps and are used to easily assess the data. Again there are different ways of presenting the data, here I have chosen to use an "axial curvature" map. There is no need to go into detail about this other than to say that there are numerous interpretations of the same data which can make the overall picture appear different. I have chosen these maps for their visual clarity in order to explain the different types of conditions that can be assessed. To explain the colour coding, the flatter areas of curvature are represented by the colder colours (ie greens & blues) whereas the steeper areas are represented by the hotter colours (ie reds & oranges).
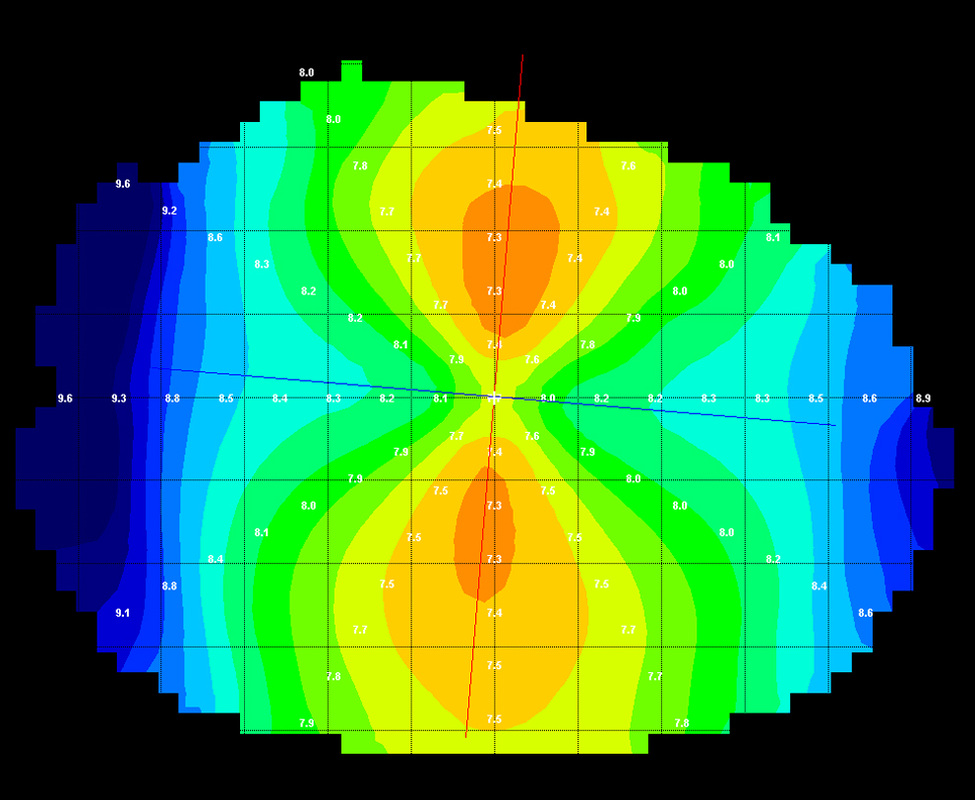
Normal PlotsNormal eye curvature is represented by a symmetrical topographic pattern. Somebody with a simple short sighted or longsighted prescription, or have no prescription at all have a "spherical" corneal surface which is represented on the left hand side here. Those with astigmatism have a "bow tie" pattern but note that this is still a symmetrical pattern .
|

Normal Plot
|
Astigmatism
|
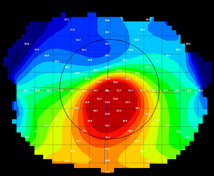
KeratoconusKeratoconus is defined by an area of steepening on the plot localised in one area, invariably inferiorly to the visual axis. The area of steepening is caused by the gradual thinning of the cornea in that area which leads to the cornea bulging out and hence the cone like shape.
|
|

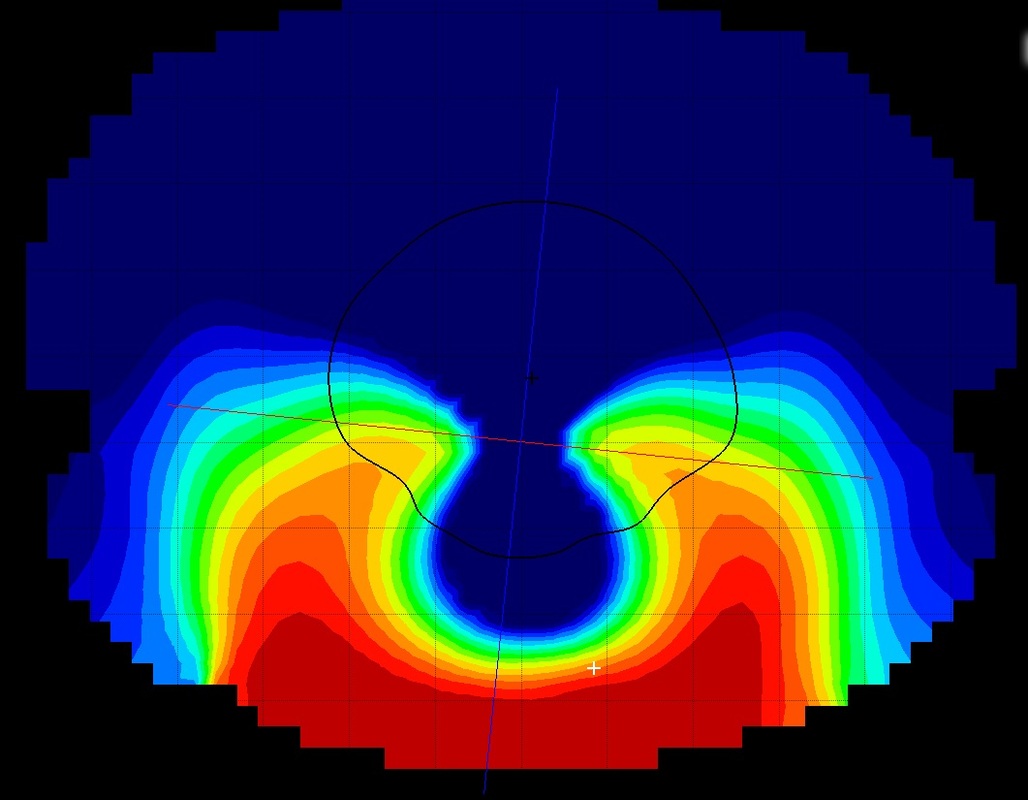
Pellucid Marginal DegenerationPMD although similar to keratoconus is defined by a markedly different topography plot. The classic plot would show the "two birds kissing" or "butterfly" pattern as shown opposite. This is created by the cornea thinning inferiorly creating the area or steepening right at the bottom. In simple terns if you look laterally to the eye and view the cornea in cross section it is often described as a pregnant belly shape.
|
Pellucid Marginal Degeneration (PMD)
|
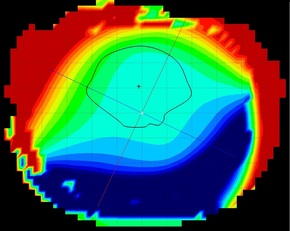
Post-Operative (Graft) or TraumaTrama/post-operative topography is completely unpredictable. Invariably you will get flattening of the cornea but there could be areas of steepening where scar tissue forms. What is common in all cases, however, is the complete lack of regularity in the corneal surface.
|

Irregular Cornea (Post-operative Graft Eye)
|
TraumaTrauma topography plots can differ greatly. They really depend on the type and location of the trauma to the cornea. What they all have in common though is a marked irregularity of the corneal surface as seen opposite.
|
Ocular Trauma
|
